


Submarine topography
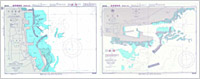
Paper Bathymetric Chart
The Basic Map of the Sea published by JHOD/JGC is the basic map of Japan. Chart titles are different according to the scale.
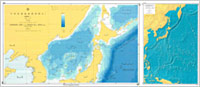
Basic Map of the Sea in Coastal Waters
1/50,000
Mainly on the scale of 1/50,000. In some locality, 1/10,000 charts are issued. This series does not cover the whole coasts of Japan.
Basic Map of the Sea on Continental Shelf Areas
l/200,000 1/500,000 1/1,000,000
Covers the whole country with 1/1,000,000 scale charts. In some locality, charts with scales of l/200,000 and 1/500,000 are published.
Basic Map of the Sea in Oceans
1/3,000,000 1/8,000,000
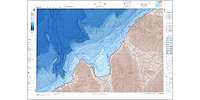
Nautical Charts
1/3,500 1/3,000
As for ports and harbors, the covering nautical charts offer submarine topographic information more in detail than bathymetric charts. The topographic information is given by soundings.
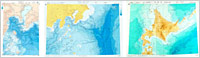
Digital Bathymetric Chart (Depth contour data, meshed sounding data)
M-7000
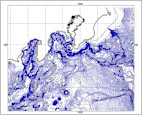
Basic Map of the Sea in Coastal Waters and other bathymetric information were compiled into the submarine topographic data around Japan. The viewer software is attached, but its usage is versatile as it can be read in ordinary GIS software.
Depth Contour Data
- M-5000
- For the user in need of local information only.
- M-7000
- For the user in need of information for wide coastal waters.
- Digital Bathymetric Counters at 100m intervals around Japan
Digital Bathymetric Contours at 200m intervals around Japan : Version 2
Digital Bathymetric Contours at 200m intervals in the North Pacific
Meshed Sounding Data
JHA 5-second/15-second Interval Meshed Sounding Data in the Coastal Waters.
JTOPO30 - MIRC 30 arc-second Grid Bathymetric Data around Japan
JTOPO1 - MIRC 1 arc-minute Grid Bathymetric Data in the Northwest Pacific
ENC(Electronic Navigational Chart)
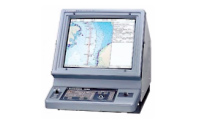
ENC
(Electronic Navigational Chart)
In certain ports and harbors, ENC shows more detailed sea bottom undulations than Digital Bathymetric Data. However, it cannot be displayed unless an exclusive software is used so that it cannot be applied to be developed into GIS software.